
Context
There is a major change in the way people commute in Metropolitan cities, after Metro Rail. It bisects the city and cuts down the commute time at almost 1/3rd during the peak hours.
Despite of being engineering marvel, for being build in the shortest span of time, it still needs a higher degree of up-gradation when it comes to availing the service.
This project is done as a design exercise for a specific requirements. The goal of this design project to address few tethering issues faced by metro user.
Design process
Research > Competitive Analysis > Design Strategy > Personas > Task Flow > Wire frame > Work-in-progress
Research Findings – Tethering issues
Reference: https://tiss.edu/uploads/files/End_User_Impact_of_HMR.pdf

Competitive Analysis and Features

Problem to Solve
- End to end service for a journey not available
- Users not knowing the optimal route to reach their destination using Metro.
- End to End service is not available. User have to shift to many apps.
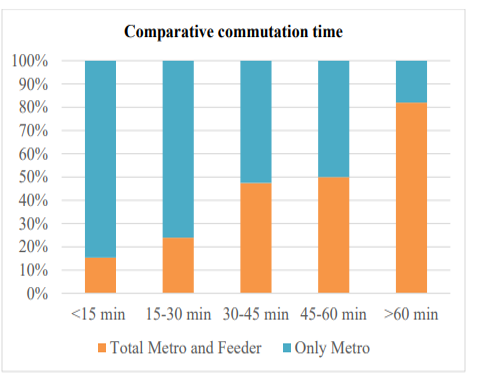
- Increased overall journey time
- Although Metro travel time is less, overall journey time increases due to poor feeder service.
- Time waste in buying tickets.
- Users not knowing the status of the trains. Reduce waiting time for train.
My Role
I was individual contributor in this design exercise. Used Adobe XD to create wire-frame.
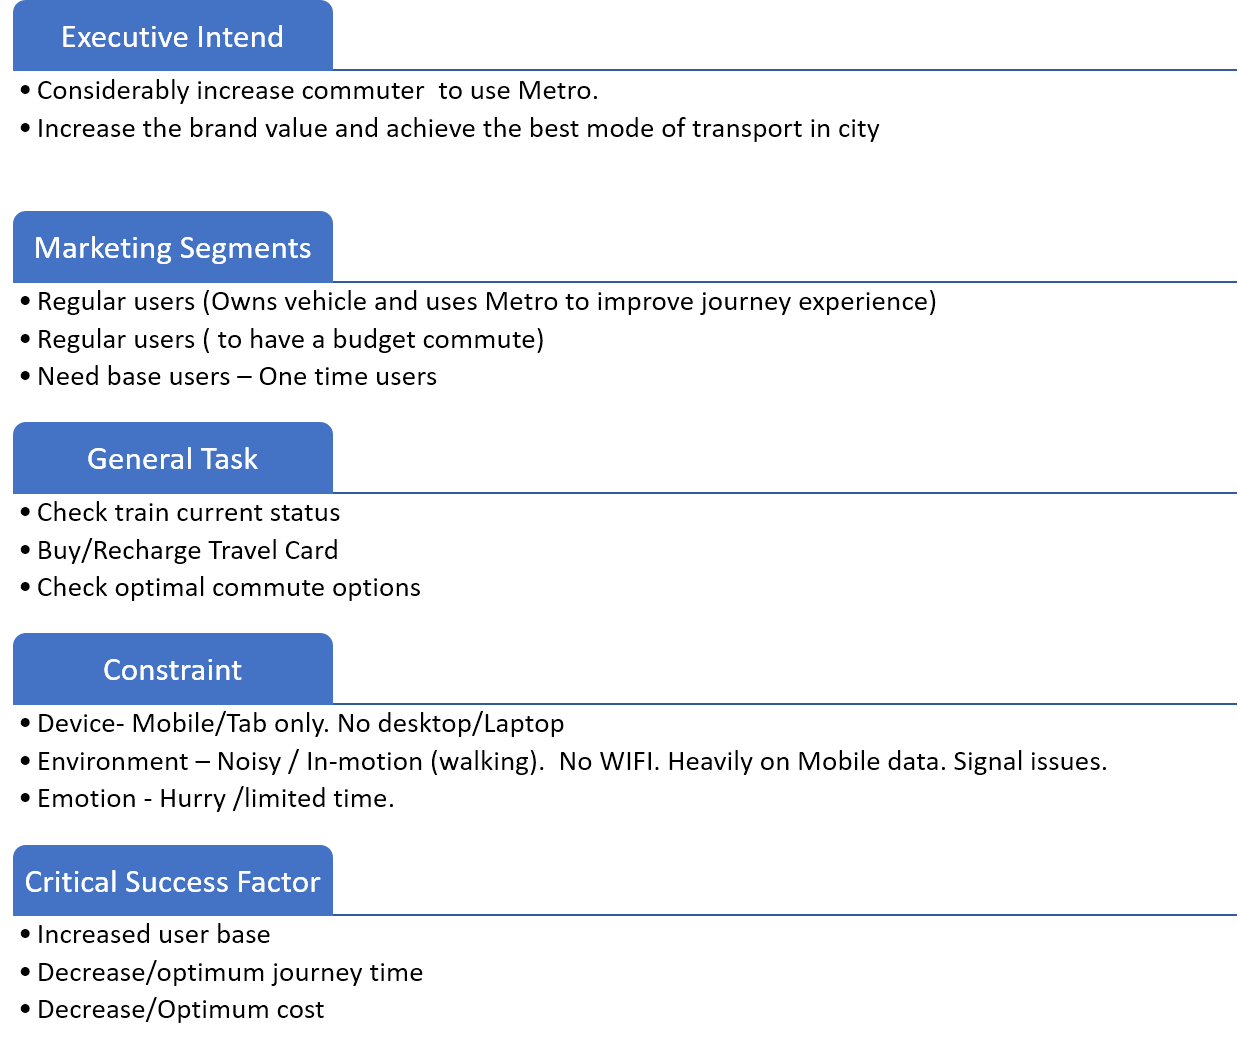
Design Strategy
Personas

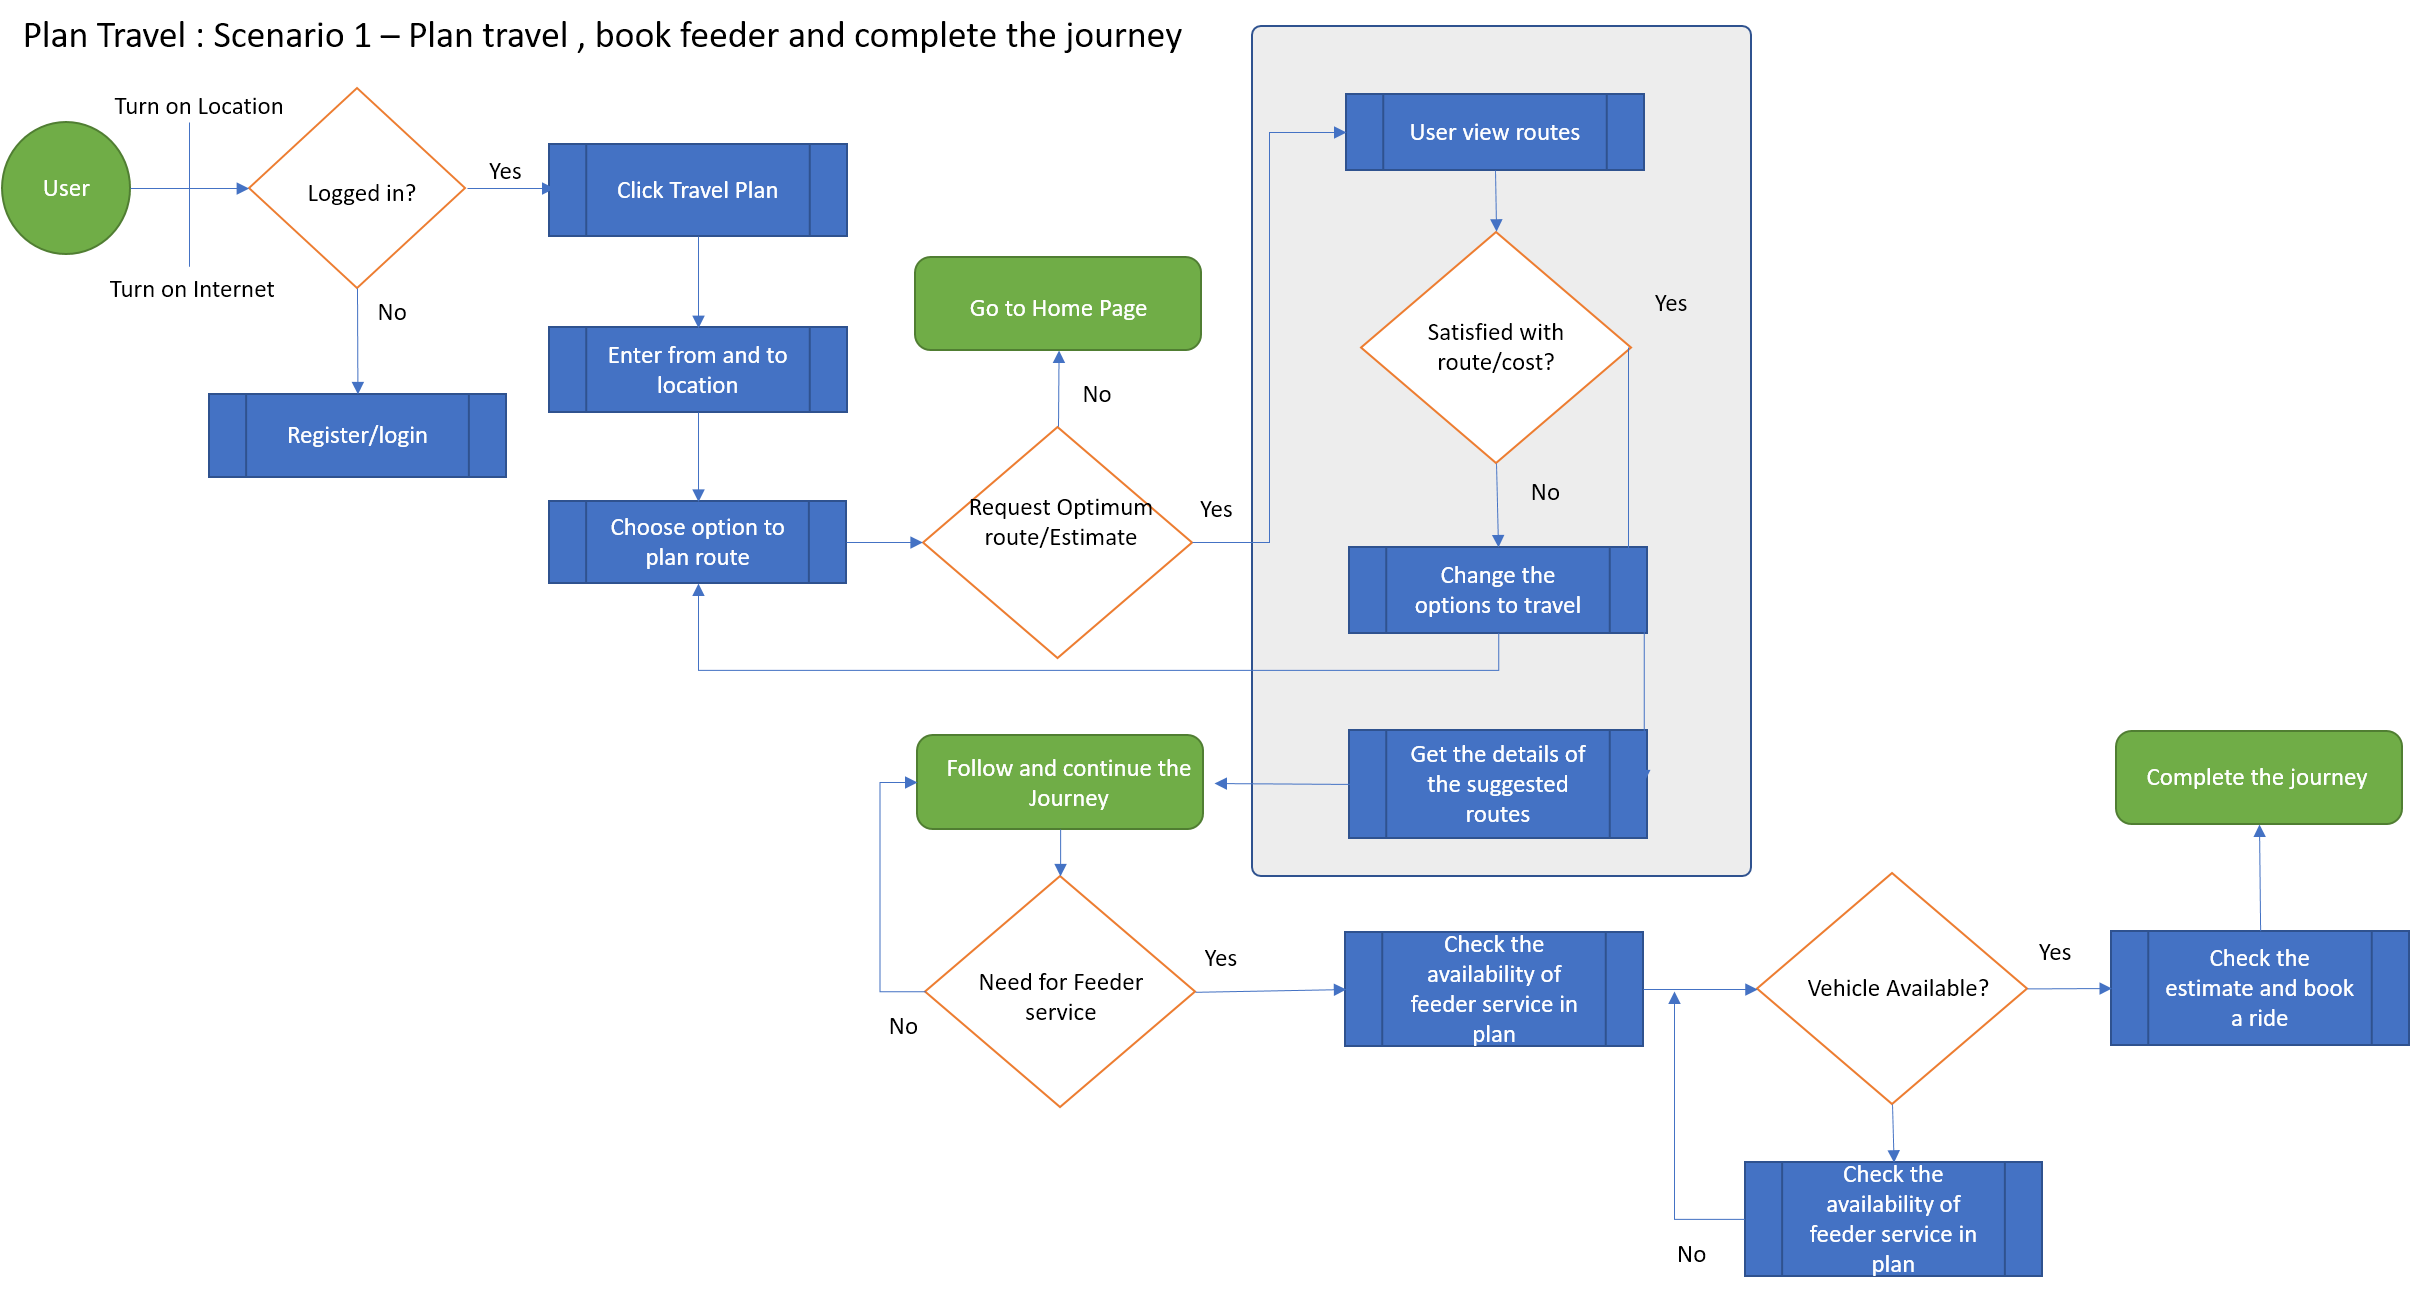
Work Flow – Sample
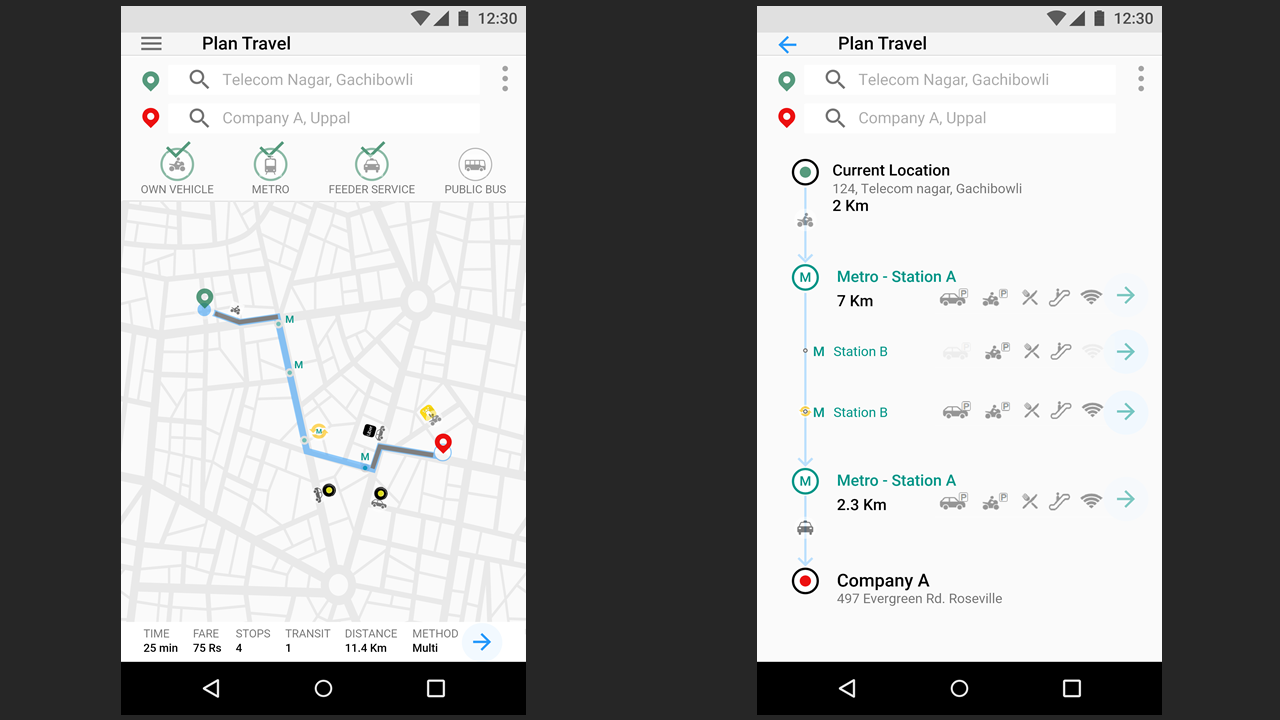
Wire frame Samples


Metrics to Measure
PULSE framework suite well for the app.
- Page views
- Number of pages viewed by a single user.
- Features that are accessed most by user
- Success Rate– The number of participants that successfully completed a task
- Uptime
- Average % of time user using the app
- Time-on-Task– The average amount of time it took for participants to complete a task
- Latency
- Amount of time it takes to transfer data from one service to another.
- # of user booked feeder service from App
- Seven-day Active Users
- Number of users who interacted with app in the last seven days.
- Features that are accessed most by user – to fine tune more
- # of Errors – The average number of times an error occurred, per participant, while performing a particular task
- Earnings
- Revenue generated by the app
- # of users recharged travel card from app
Conclusion – Not yet
Project work-in-progress, will be updated periodically.

Leave a comment