
VISION is an enterprise forecasting platform that transforms historical data and emerging trends into forward‑looking insights, enabling smarter and more confident decision‑making.hood of various events.
Problem to Solve
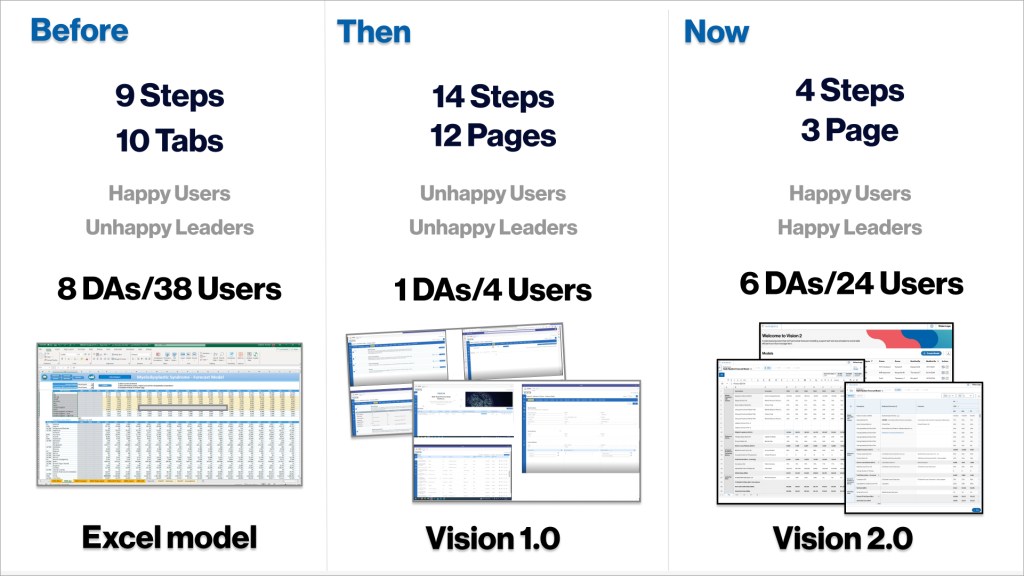
Extremely low user adoption
Result
Lessons Learned & key takeaways
- Identify the true decision‑maker early (and manage leadership transitions smoothly)
- Reconfirm product direction regularly with stakeholders
Take aways!
- Map the stakeholder ecosystem early
- Document the product vision in a way that survives transitions.
- Create alignment checkpoints.
- Run a “Vision Reset Workshop.”
- Build relationships with multiple leaders, not just one.
Questions from Stakeholder
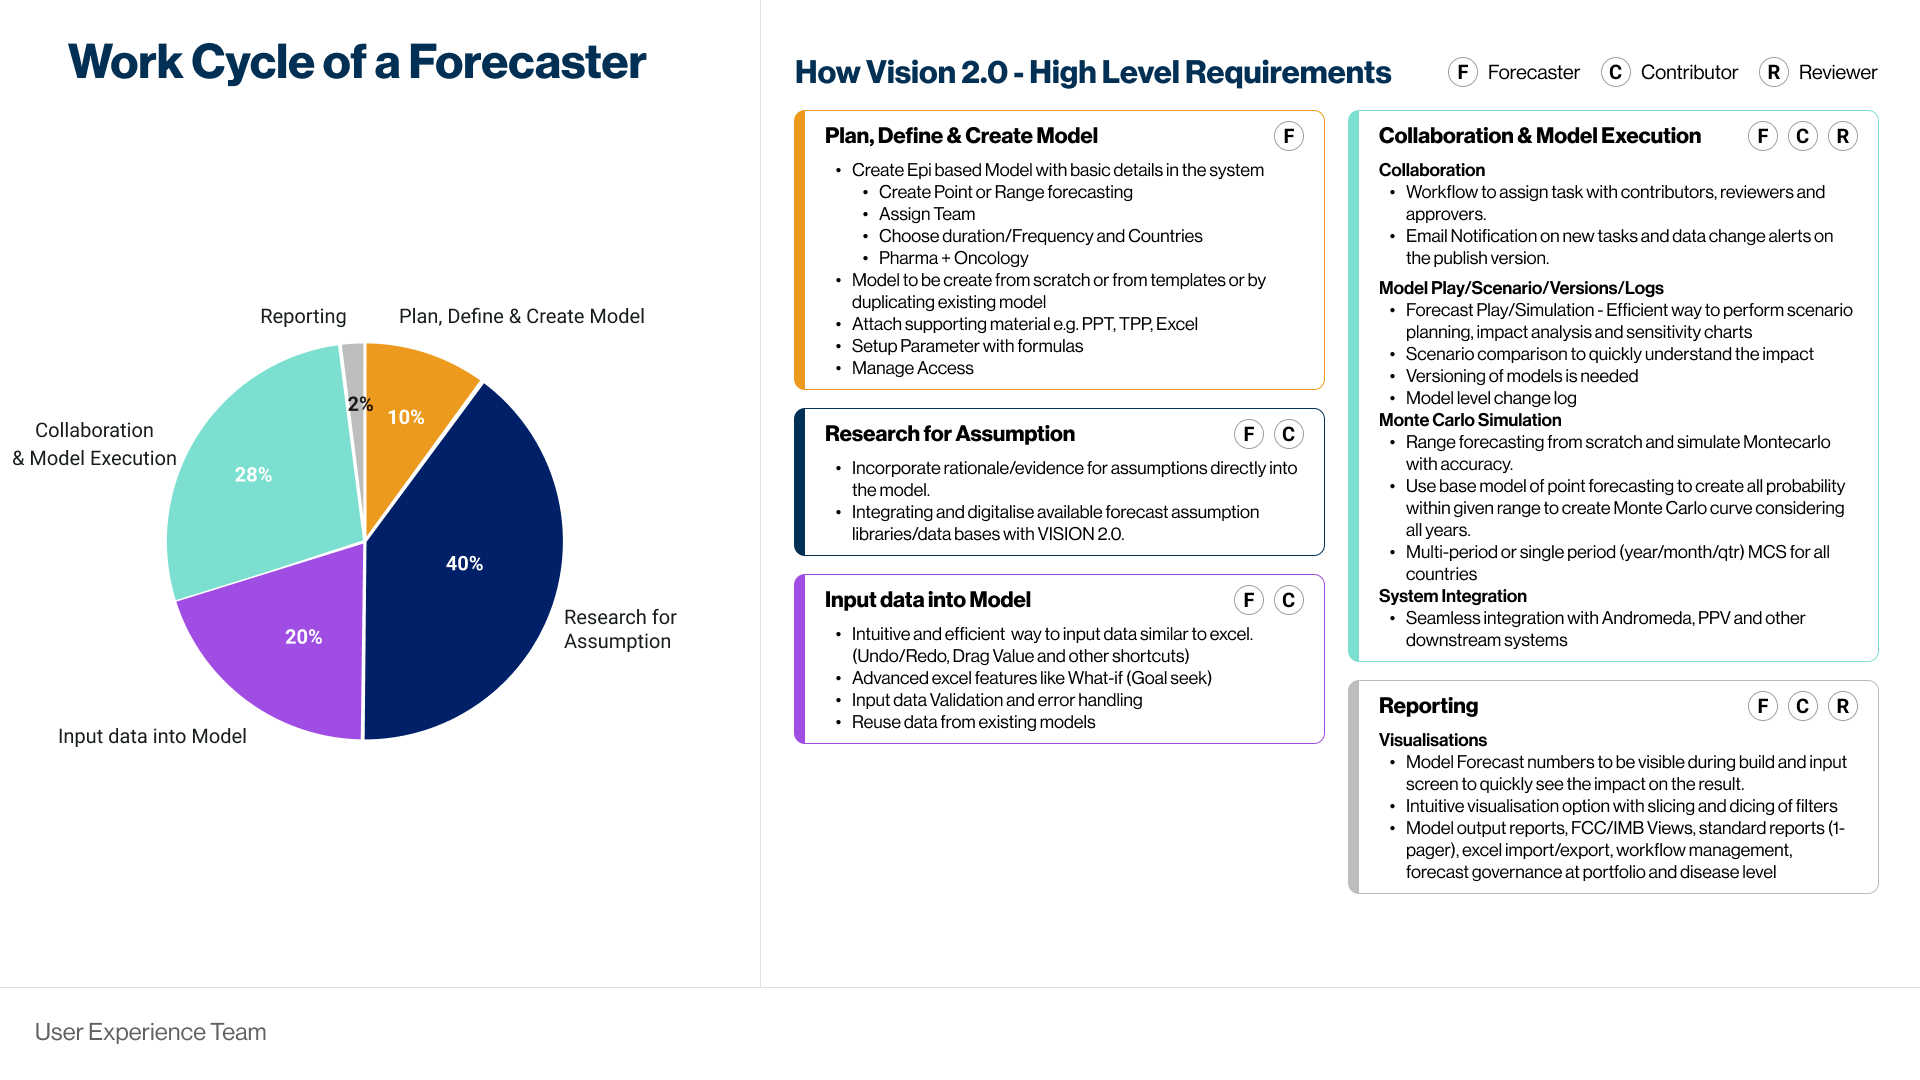
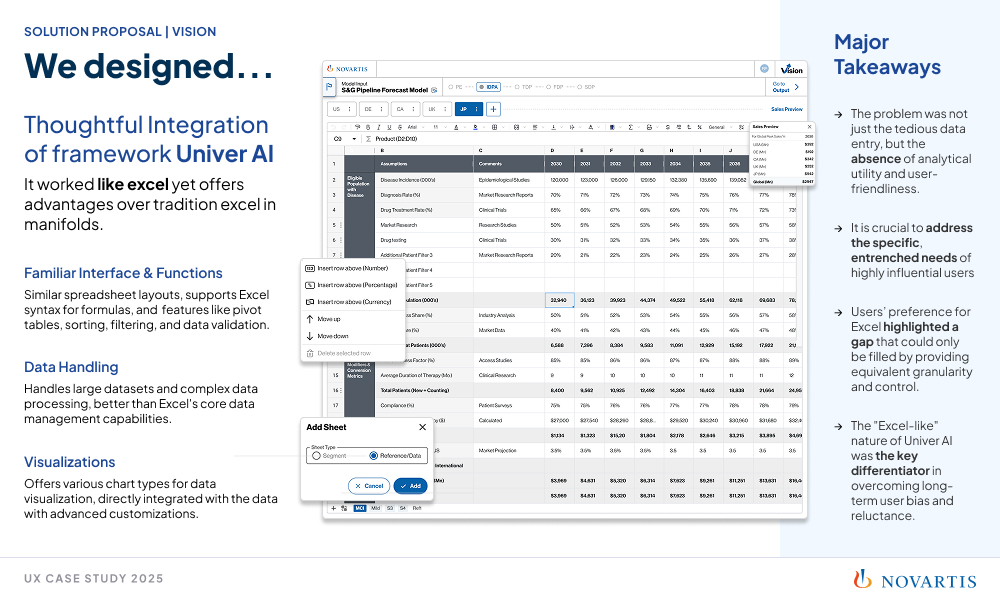
How might we transform Vision into the single source of truth for all forecasting data?
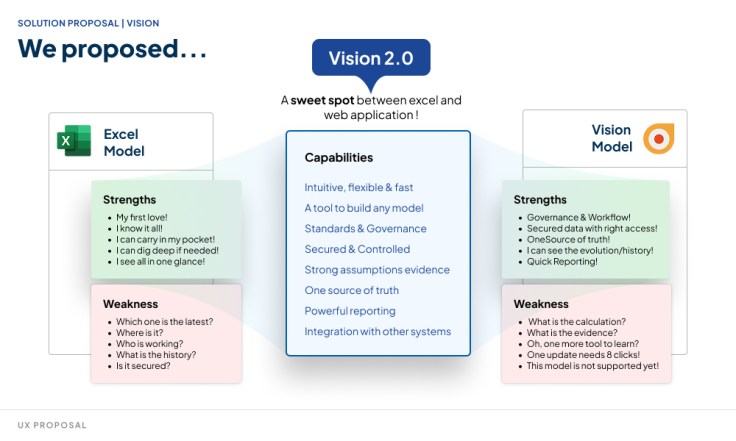
How might we reduce dependency on Excel while preserving the flexibility users rely on?
How might we improve adoption so users choose the app because it’s valuable, not because it’s mandatory?
My Role and UX Vision
# Lead Designer in a team of 3 Designer. [ along with 12 team member from different Cross Functions]
To transform VISION into a truly transformative forecasting application—elevating it from a manual, error‑prone task to a reliable, insight‑driven capability that supports smarter, faster, and more confident decisions across the organization.
UX Strategy followed
Understand the Past : Reviewed all V1 documents to uncover the original business need, identify gaps, and understand why the earlier solution failed.
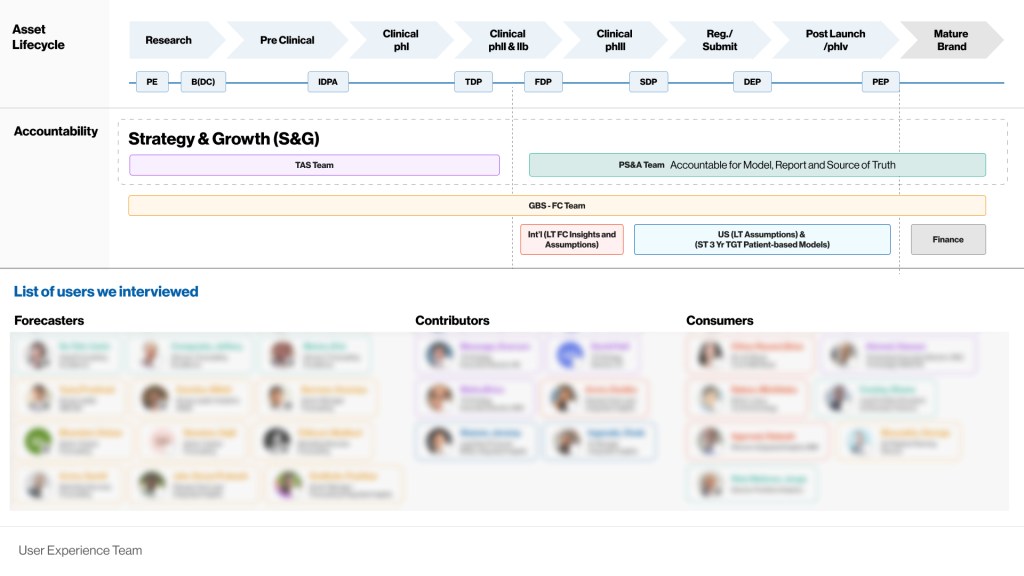
Listen to Users & Stakeholders : Conducted interviews and workshops to gather real pain points, clarify expectations, and rebuild trust.
Evaluate the Existing Experience: Ran a heuristic evaluation of Version 1 to pinpoint usability issues, interaction gaps, and workflow breakdowns
Explore the Market : Did market research on similar forecasting tools to guide the Buy vs Build decision and identify best‑in‑class patterns.
Iterate Quickly : Followed a tight design loop:
Design → Test → Rework → Test → Build → Test → Refine
Ensuring continuous validation and reduced risk throughout the process.
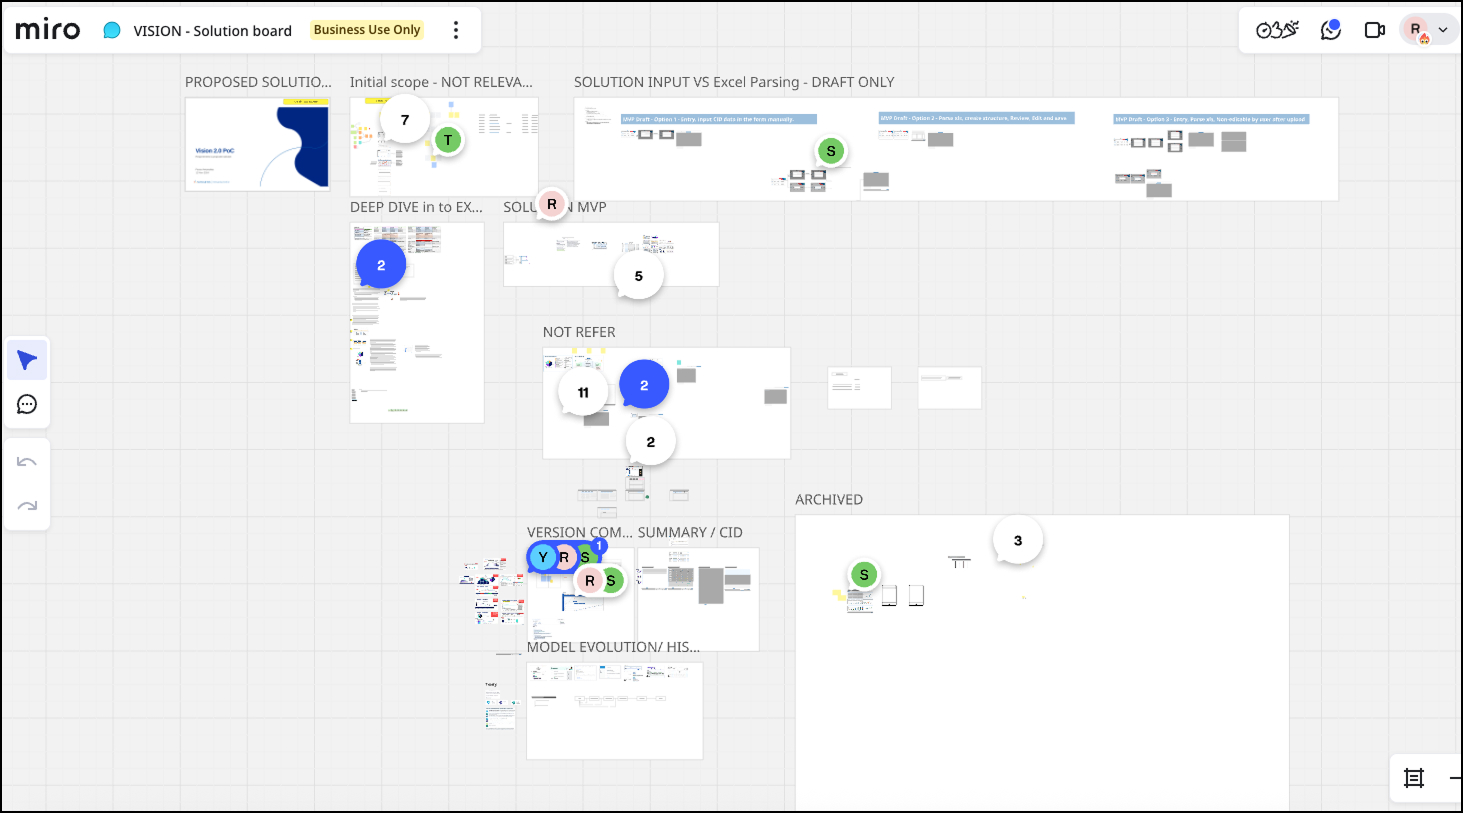
Research/Workshop Deep dive
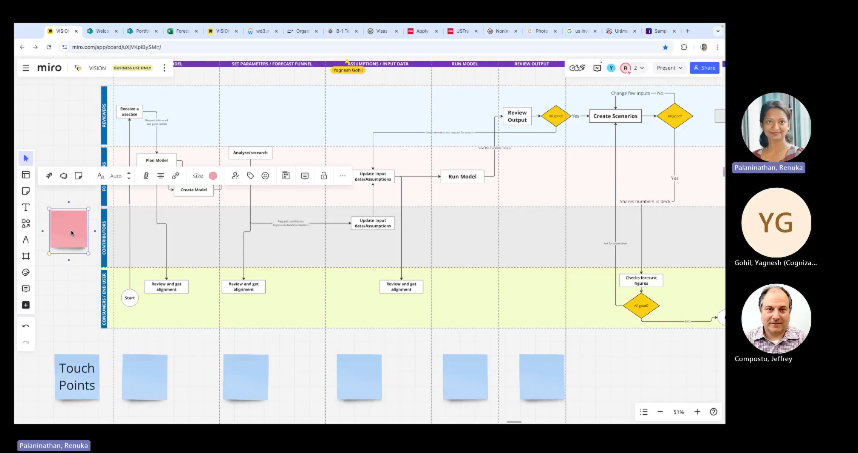
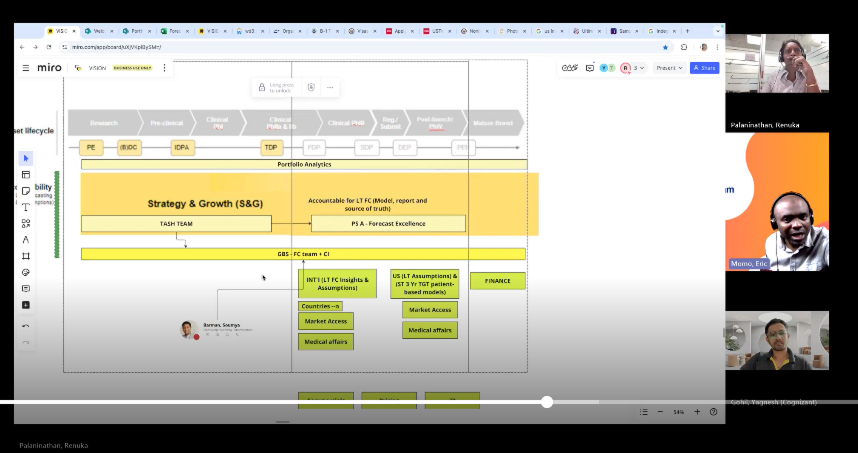
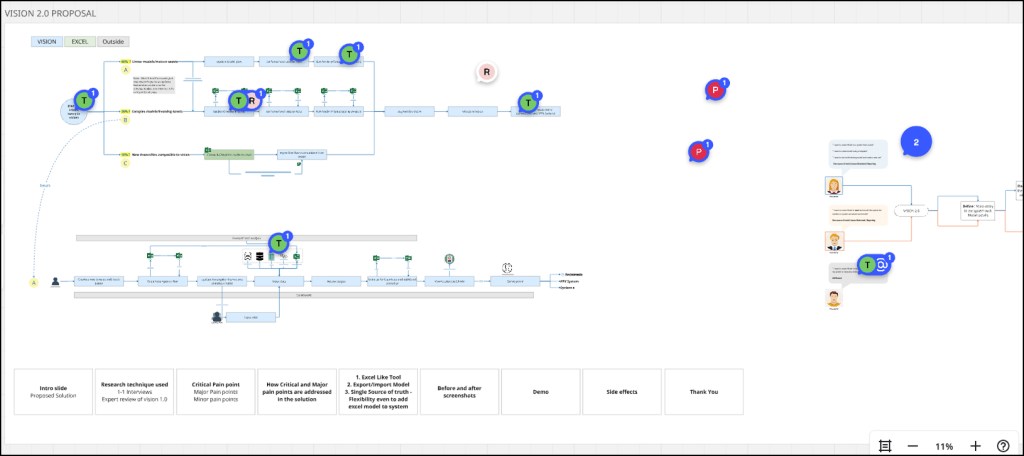
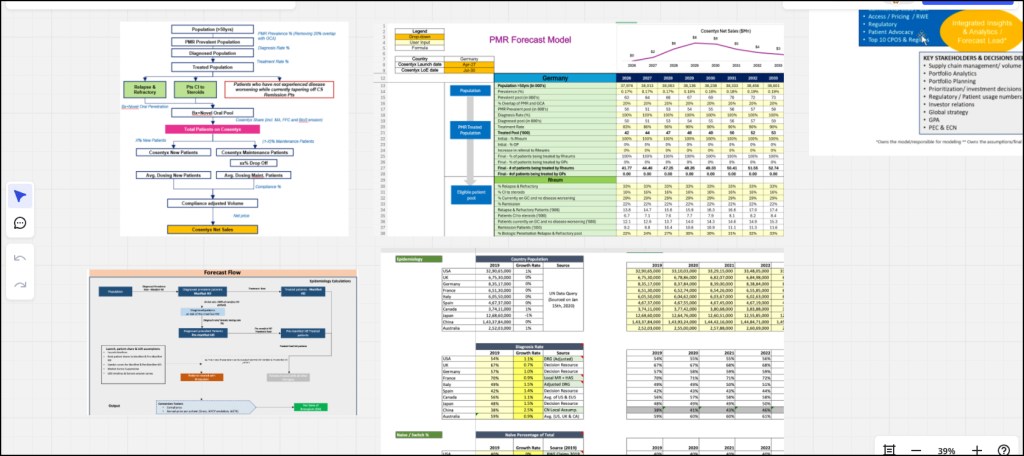
Research Output
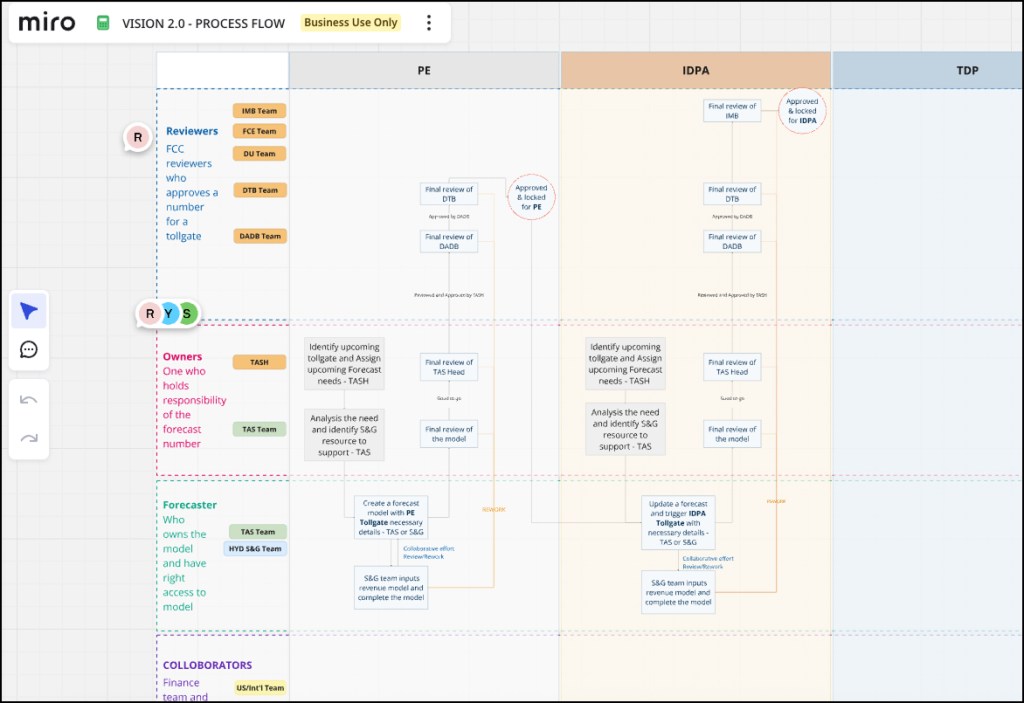
Brainstorming / Wireframe
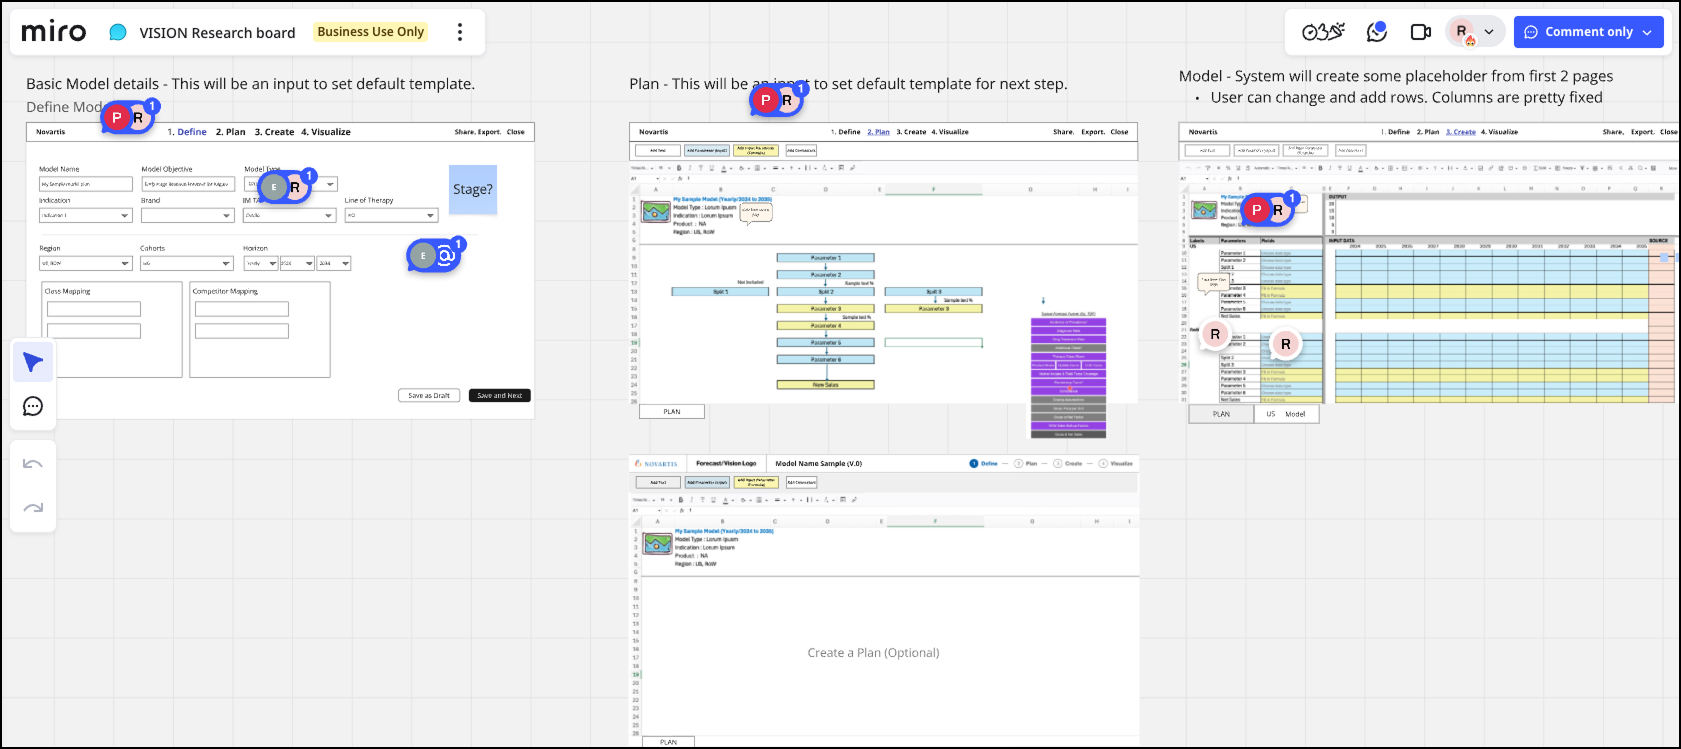
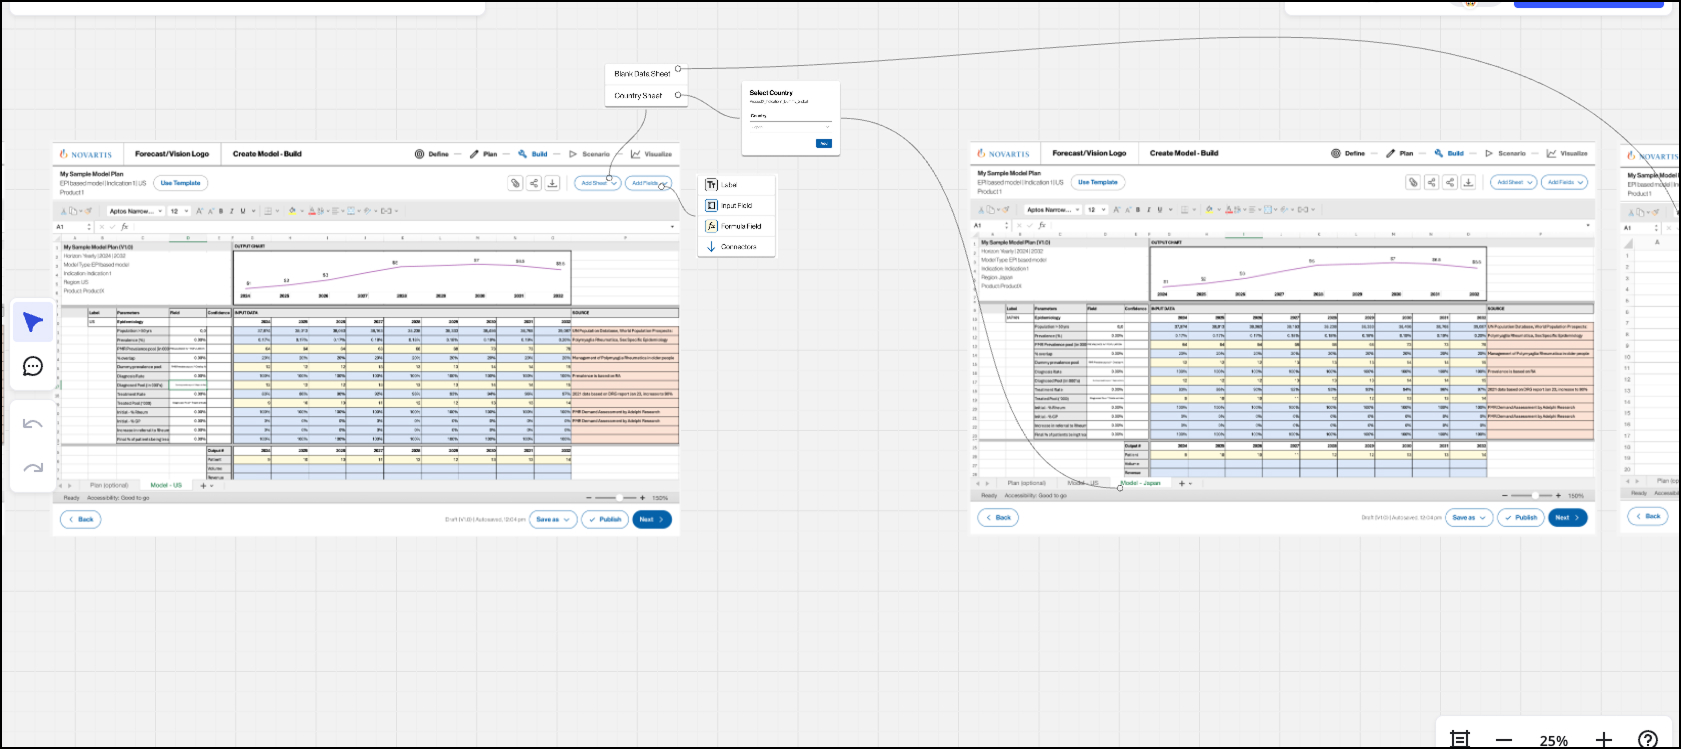
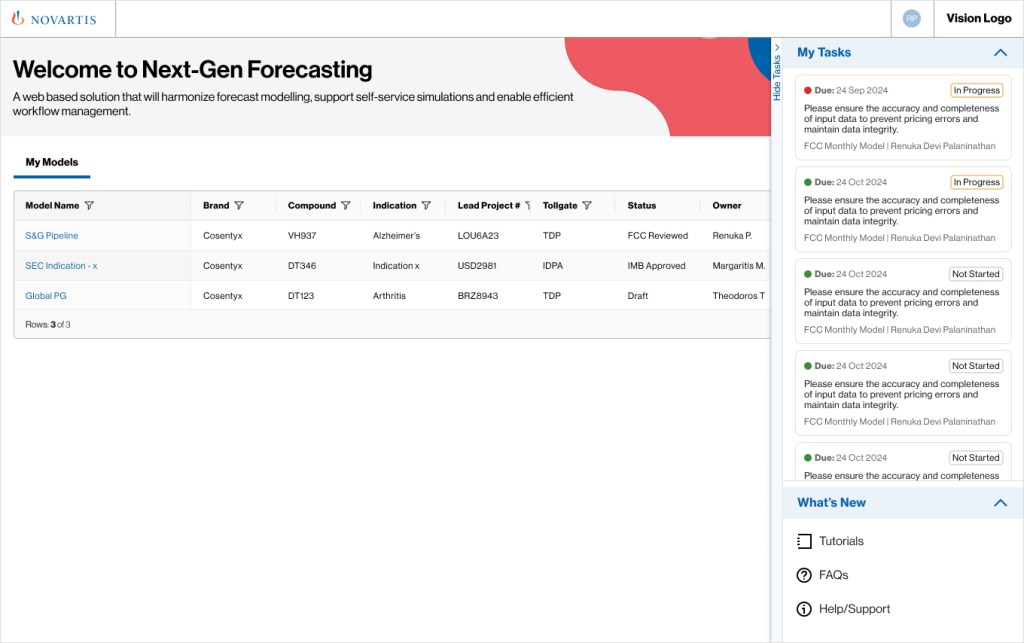
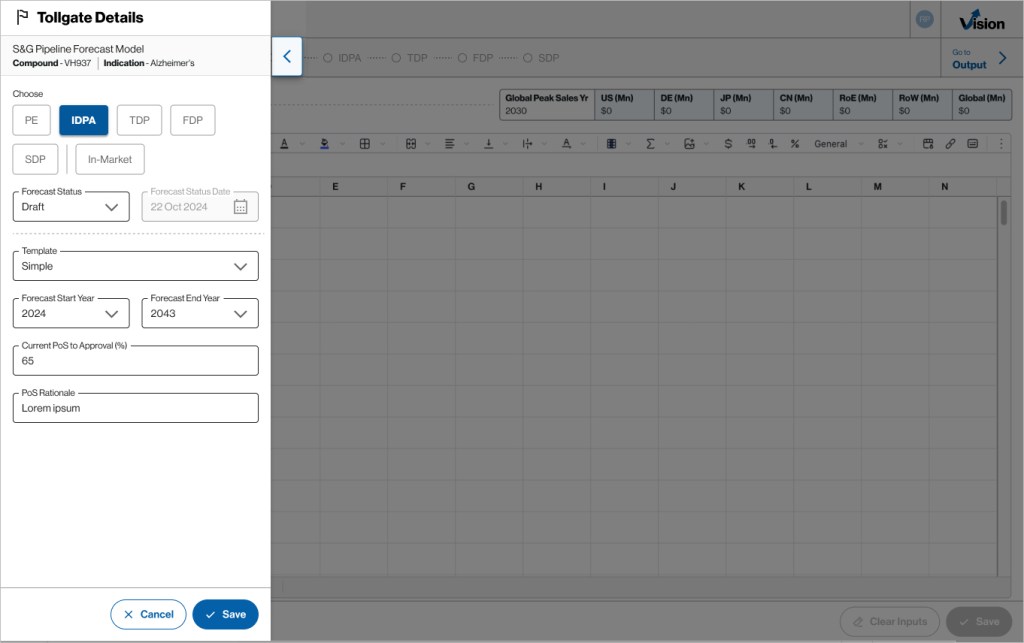
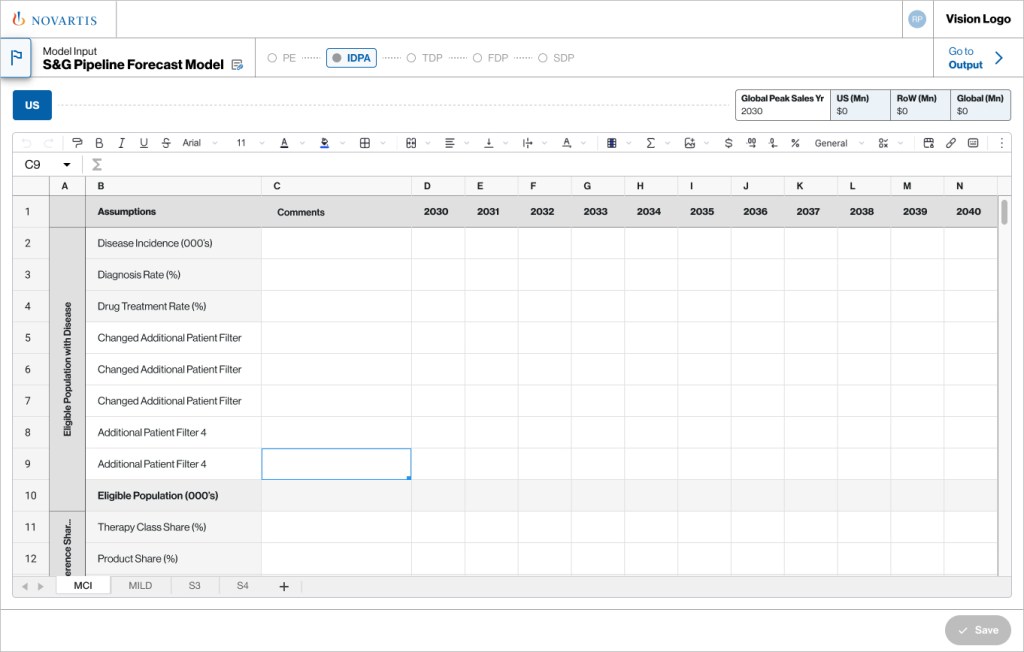
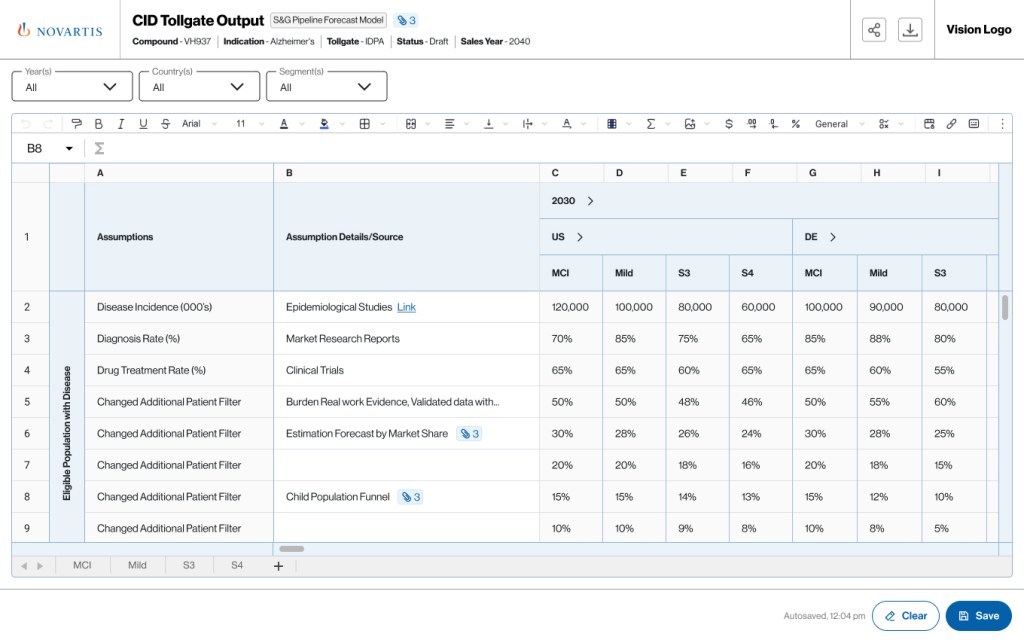
Final Design
Result
Reduced Complexity: 12+ Pages → 3 Pages
24 active users immediately onboarded during MVP release
6 Disease Areas successfully transitioned into the new system
Single Source of Truth
Self‑service Reporting
A Roadmap Full of Possibilities

Leave a comment